
Year Ending 31/12/18 Performance: +12.50% (+16.22% annualised) - Part 1/2
Note: Performance figures are quoted net of any transaction costs but before taxes (incl. dividends received but no franking credits incl.). See Appendix A + B for further details of performance from 2017-18. Past performance is not an indicator of future performance. Portfolio is unaudited. Performance figures annualised, using the Modified Dietz formula provided here.
Quick Introduction
I thank Alleron Investment Management for giving me my first work experience in funds management in early 2018, which paved the way to my passion for funds management. That was all because of my mentor. My featured image for this blog, is to pay respect to his guidance over the last ~1.5 years he has given me, and with which I hope to continue under in the coming years.
This is now my second time writing a performance blog, so forgive me if this isn’t as professional as other fund managers. Due to the nature of my full-time work which I will begin in February 2019, I will likely have to cease reporting my performance for the sake of my clients, but that remains to be seen.
I split my report into 2 parts because there was simply too much content to post, so please bear with me. Part 1 explores the 2018 that was, whilst part 2 focuses on the 2019 to come (see here now).
So below is my report for the FY18 year (i.e. 01/01/18 to 31/12/18) on my performance for my personal equity fund which I use to invest in shares. The broker I use is Commsec (i.e. trading platform of CBA), and with a CDIA account, they charge $20 per trade generally.
Before I get started, I do want to make a point that although people see this kind of ‘hobby’ of mine as simply being done to make money or build my CV, that was never the case for why I started this blog. As simple as it sounds, I enjoy researching stocks and by extension making investment decisions from my research. I said this in my YE 31/12/17 report, and I continue to stand by this (see here).
I am incredibly thankful to God that I have the opportunity to work in a hedge fund and apply my passion productively to the real workforce, for the benefit of others rather than just myself. It’s important to be grateful for the work that I have while it’s there since nothing is ever certain with the job market!
Since my thoughts from last performance update on YE 31/12/17:
Did I get anything right from my predictions for 2018?
I made a few macro calls, which can be found here, and needless to say, I did not get many of them correct (better than none though!). I am not surprised that not many calls were correct. As I stress time and time again, making macro calls is incredibly difficult (always easier in hindsight) and I certainly do not claim to have any edge in that over other people.
Just a few comments I would like to make though:
Many Australian consumer discretionary stocks looked alright in the 1st half of 2018, but the 2nd half of 2018 led to less optimistic trading updates from the likes of The Reject Shop, Lovisa, Myer, and Michael Hill Jewellery to name a few.
North Korea and US seem to have all been forgotten which is something I was not surprised to see… What instead dominated the headlines in 2018 was certainly US and China in their trade war instead.
I was not surprised to see the quick rise of the Fed rate in the US by Jerome Powell, although I was surprised that the RBA remained on hold with the cash rate at 1.5% for the entire 2018. This suggests that inflation generally, has probably not picked up meaningfully enough for the RBA to be comfortable to raise rates.
One definite mistake, included thinking that the USD/AUD would be flat at about 78-80c, but the USD rallied upwards on the back of Jerome Powell lifting the Fed rate towards 2.5%, from the 0.75% during 2018. Intuitively, you would think that most US fixed income assets are benchmarked on interest rates, and so, the attraction of a potentially now higher risk free return increases demand for the USD to buy said assets, which pushes the USD higher, relative to other currencies like AUD. As such, the AUD did not behave in the ‘commodity’ like way that I had expected which would be driven by Chinese demand for mining exports from Australia (note that iron ore and coal make up the two largest exports in Australia).
Unfortunately, the Chinese stock market (e.g. Shanghai Composite and Hang Seng indices) were both down about 20-25% for the calendar year of 2018. However, the fundamentals do continue to look strong despite the trade war rhetoric that continues to be thrown around. By fundamentals, I mean that companies are still generating profits and producing cash flow, in general. Three stellar Chinese companies I would point out are Tencent, Ping An Insurance and Alibaba, all producing fair earnings and cash flows despite increasingly competitive environments and government regulation.
We certainly saw a US tech correction in October 2018, which led to the FAANGs (Facebook, Apple, Amazon, Netflix and Google) being flat or down in their share prices for the year. Notable down examples include Facebook, Apple and Amazon which had experienced relatively violent corrections recently.
Although the ASX did reach about 6400 points leading up to August 2018, it then entered a correction which ended the ASX down 7% for the calendar 2018 year, meaning it ended at about 5700 points.
Emerging markets have certainly been a mixed bag, with some continuing to hold up like India, although many others like Argentina, Venezuela and Brazil all struggling, as seen in the massive devaluations of their currencies during 2018, consequent of hyperinflation experienced in these countries. This reminds me somewhat of Zimbabwe with its hyperinflation in the late 1990s.
As noted, some mining stocks in AU continued to perform well like BHP and Emeco Holdings, although it was a clear mixed bag as well, like Ausdrill which went down.
Overall, it is quite clear that predicting in macro terms what will happen in the next year is incredibly difficult. I clearly made a lot of wrong calls. However, it never hurts to try if done appropriately.
Brief notes on 2018 performance and thoughts in general on stock markets:
The calendar year of 2018 had proven to be incredibly difficult for the ASX towards the end. The global synchronised growth narrative was the craze in early 2018. Leading up to August, the stock market was firing away, particularly in February and August reporting seasons, which are 2 key periods for share price re-ratings. They were both generally good seasons in terms of fundamentals (like earnings and cash flow), although it should be noted we had a slight hiccup in early February from fears of inflation picking up faster than the market thought in the US (from wage growth inflation), which meant that interest rates could be hiked faster by the FED than the market had priced in. Note that interest rates act like gravity on asset prices.
From the top of my head, here are 9 interesting events I took away during the 2018 for Australian companies:
Royal Commission with Commissioner Hayne leading the attack on the banks, financial service and superannuation companies
Corporate downfalls for varying reasons with examples including RCR Tomlinson, Big Un, IOOF, Freedom Insurance and Blue Sky Alternative Investments
Westfarmers announcing the spinoff of Coles (which had originally been acquired back in 2007), for a transaction valued at ~$16b market capitalisation
Commercial banks such as CBA, Westpac, simplifying their business in the form of selling off non-core assets including wealth management arms, insurance arms, and super arms
Telstra slashed net 8000 jobs, and split itself into a retail arm, and a separate infrastructure company, with capex plans for 5G and a restructure that led to a relatively new management team
Nine-Fairfax merger in a $4b deal, with 50.1% in a new company being owned by Nine, and for obvious reasons such that Nine could get a stake in Domain (ASX: DHG)
BHP sold US oil and shale assets for USD11b, with capital management delivering special returns to shareholders in the form of share buybacks and special dividends
Myer posting a $500m loss for FY18, and retail environment in general getting softer as weakening housing cycle hurt consumer spending leading up to Christmas
AMP crashing 25% from the sale of their life business for a low EV/EBITDA multiple (along with franking credits wasted) which attracted negativity from several fund managers like Alan Grey and Merlon Capital
There were certainly some themes coming back. Growth investing does appear to begin showing a few signs of weaknesses, with value investing possibly beginning to show some signs of improvement. I would like to reiterate that my style of investing, which is primarily influenced by my mentor, is quite agnostic between value and growth investing styles. Perhaps that helped my portfolio in some respects for calendar 2018.
Rising input costs, industry consolidation and increasing online competition and regulation were trends in 2018. However the bigger correction we saw happened in September, October and November, where stocks generally across the world (and not just AUS) were getting sold off. Virtually all indices across the world finished down for 2018.
I was surprisingly pleased by the portfolio, which delivered +12.50% in 2018, and 16.22% (annualised) since Jan 2017 to Dec 2018. Relatively speaking, against the ASX200 Accumulation Index (see here) which was -2.43% for the calendar year 2018, I had outperformed favourably. Note that relative to other countries, the ASX actually performed reasonably well, falling less than other developed economies. I want to reiterate that 1 year (or even 2 years) of performance is not entirely meaningful, and am reminded that at least 5 years would be a better indicator.
This is certainly in some respects, an abnormal return that I should not be expecting in the future.
However, credit should be given where due. I certainly admit there was a lot of luck in having a favourable allocation weighting to Afterpay (APT), and also being on the ‘right’ side of The Reject Shop (TRS).
I am reminded of Steven Ng, from Ophir Asset Management, who said:
“Growth hides all sins”
That was certainly the case for me, with Afterpay hiding certain blunders like ISelect. More on these stocks below.
Stocks in portfolio for review in 2018:
I know that this yearly report can be a big mouthful to digest (it’s about 6.5k words in length and that doesn’t incl. part 2!), so I have done my best to try to pluck out the key points for each stock I discuss, and maybe a lesson I took away where possible. As such, I cannot discuss in detail, all the stocks in my portfolio that I would like, but I will try my best.
Losers in 2018:
ISelect (ASX: ISU) – sold in Jun 2018, at the ~81c mark:
I admit, this was one of my ‘legacy’ stocks from 2017, where I certainly did not stick to the process that I had developed, and had made a seriously terrible (and perhaps dumb) decision. The original thinking for this stock, was the ‘net cash’ position of ISU, which had no debt. It ‘looked’ cheap. I got carried away thinking that ~$1.40 mark was a 52 week low, and bought on that basis. I read the FY17 and 1H18 investor presentation results, and assumed I understood the business. I didn’t even really consider any valuation metrics… ISU does have a relatively stable top line sales, although costs tend to be very volatile, considering the marketing campaigns they run (which often are blunders that don’t attract nearly as much sales as one would like).
The nightmare began in early 2018, when a trading update cut the profit guidance to ~$12m underlying EBIT (prev ~$28m) for FY18, and the former CEO, Scott Wilson immediately resigned following the update. The EBIT cut, is about 57%, and assuming no changes to financing or tax costs, on a maintained PE basis, it was no surprise the stock fell from $1 to about 45c, which is a 55% decline. Not that surprising it was almost 1 to 1 in share price and earnings decline for ISU.
I began to realise just how unpredictable the profit guidances were from ISU. This wasn’t the first time that ISU had ‘missed’ their guidance.
However, what was interesting to note here was that at 45c on 23 April 2018 (following the terrible trading update from above), if you applied the Ben Graham net-net formula (see here for deeper explanation), your ‘liquidation value’ of ISU would come to ~$148m. At the 45c, when you multiply that by the shares outstanding, that comes to ~$98m!
This is a situation where the ‘liquidation value’ (based on Ben Graham’s formula from 1949 in his book “The Intelligent Investor”), has a value that is higher than the market capitalisation of the entire ISU business. That effectively means, if you could buy the entire business today as sole shareholder, and sell all your assets, you should theoretically get a profit of $148m – $98m = $50m! See Appendix C.
That is a bargain stock! Alas, I did not pay attention in time to that opportunity for a cheap buy, and it is no surprise that a competitor, Compare the Market, built a substantial stake (i.e. greater than 20% holding) in ISU which pushed the share price back to a stable 80c range. Imagine if I had bought at 45c and the stock jumped back to 80c. That would have been a simple 35c profit for me… Unfortunately, it should be noted that these net-net opportunities are not as common today, as they were back in 1949, and there are risks to buying such companies, like bankruptcy potential.
Commonwealth Bank of Australia (ASX: CBA) – held for entire 2018:
CBA remains a position from late 2017. It was a tough year for the banking sector. Ever since the Royal Commission into Banking, Superannuation and Financial Services, which began to weigh on banking stocks like CBA (and the rest of the Big 4) since March 2018.
What impressed me during calendar 2018, was that CBA (-9.76%) held up better than Westpac (-19.87%), ANZ (-14.42%) and NAB (-18.6%). CBA has always traded at a premium on a price/book metric. I bought CBA on the basis of a 6% dividend yield (excl. franking credits), and P/B of about 1.5x, when the historical average has been about 2x (over the last 10 years).
This is the first time in perhaps several years, where the banks are beginning to look attractive on valuation metrics again (like dividend yield and P/B). CBA was fined a whopping $700m for the AUSTRAC scandal, the biggest corporate fine by a long shot. The former CEO and Chairman left, and Matt Comyn (new CEO) and Catherine Livingstone (new Chairman) joined in to clean up the mess and restore customer trust during FY18. The retail banking sector performed impressively in FY18, maintaining a 9% sales growth despite difficult circumstances. That really goes to show the power of the retail brand.
The new management team look impressive, doing what they said they would do, which focused on simplifying the bank, by selling Colonial First State Global Asset Management (for $4.1b) and Comm Life/Sovereign (for $3.8b), at reasonable EV/EBITDA multiples. Matt’s capital management so far has proven decisive and thoughtful.
The reaction during the Interim Report released by Commission Hayne in later 2018, was met with a share price rally, as the result was not as bad as the market anticipated, possibly because it was more about motivation of poor behaviour in banks, rather than actionables to address said actions. However, many sell side analysts from investment banks (like UBS and JPM) have downgraded their outlooks for CBA in 2019. Whilst I think some concerns like pressure continuing in net interest margins, and ongoing compliance costs are evident, much of that appears priced into CBA already in my view.
What will need to be watched closely, is the growth in loans issued to customers, which will clearly slow down because of tighter lending standards from the Royal Commission. The speed at which it slows down will be interesting to watch. Consequently, it would not surprise me that this feeds into a weakened property cycle, as lending becomes harder to obtain to support the purchase of houses in Australia, meaning crimped demand could see housing prices fall further in 2019.
Alas, I continue to remain positive on CBA for 2019 and beyond. The 1H19 result may be muted because of the release of the Final Report from Hayne in February 2019. I do not think the impact will be as material as the market expects. As such, the banking sector may experience a kick-start upwards again, following the final report. This final report is one to watch closely.
The Reject Shop (ASX: TRS) – sold in Oct 2018, at the ~$3 mark:
TRS has been a love-hate relationship. In this instance, I was a poor judge once again, on the quality of management. Ross Sudano, the CEO whom I believed had great experience in turnarounds, downgraded the 1H19 profit guidance to $11m NPAT (previously $18m NPAT). The cut of circa 39%, translated into the share price falling 40%, to maintain the PE basis, which was no surprise. This was certainly a let down compared to the 1H18 result, where the NPAT was at the higher end of the earnings guidance.
Comparable sales growth in the first 15 weeks of FY19 had decreased 2.4%, which led to a rather violent selloff in the stock, as the market extrapolated this to indicate poor performance for the rest of FY19.
The retail outlook, looked gloomy for many, as they all began to cite rising costs of doing business, and increased online competition continuing to depress the margins of many retailers like TRS. The issue with TRS, is that a lot of their goods in inventory which they sell in their vast ~350 store network, are paid for in USD. The rising USD in 2018 was no help, pushing COGS expense higher for TRS in FY18/19. My thesis for the marketing campaign delivering increased sales growth (and was a signal for evidence that the management strategy was working) did not come through, and as such, I sold the stock quite decisively on that basis.
Winners in 2018:
The Reject Shop (ASX: TRS) – sold in Nov 2018, at the ~$2.80 mark:
However, TRS also proved to be one of the best short-term investments I ever made. Some think what I did was a “trade”, rather than an investment. I wish to say that I stuck to a process, which allowed me to buy at the right price, and ultimately sell out when I thought the valuation was fair.
I never thought I would see another Ben Graham net-net stock, and low and behold, I found another one in November 2018. Only this time, I seized the opportunity that I had missed from ISelect. On Ben Graham’s formula for liquidation value, I had calculated ~$67m. The market capitalisation for TRS at the $2.02 share price was ~$58m. So effectively, if you were to buy the entire business today, and sell it for theoretical liquidation value, you would profit $67m – $58m = $9m! See Appendix D.
This was a clear Ben Graham net-net stock. Just like ISU, it had no debt on the balance sheet, so that was not a worry in the calculation. Something I remember Peter Lynch (a famous Fidelity fund manager from 1977 to 1990) jokingly saying about these kinds of stocks is that (see lecture here):
“It is very hard for a business to go bankrupt if it does not have any debt. It’s very tricky…”
I admit I was incredibly nervous to go back into a stock in which I had lost money. However, the fact that I had learnt my lesson from ISU, pushed me to buy the stock. I did not think TRS would go bankrupt. There were obviously concerns that the majority of TRS’ stores were operating leases, which meant the “debt” was an effectively off-balance sheet, as TRS only needed to debit operating lease expense, credit cash. However, the change in AASB 16 standards for leasing meant reclassifying virtually all operating leases as on balance sheet, as part of lease liability, which finance leases already made up.
This means several issues going forward, which the CFA program has taught me. Ultimately, it means your reported expenses will be higher in the short-term, but lower in the long-term. From a simple Du Pont analysis, you would realise that profit margins, leverage and asset turnover would all be affected, even though fundamentally, the lease contracts have remained the same. That is why, it is not a big deal to me.
I got incredibly lucky, when the Geminder family (who owns 38% of Pact group, a large packaging company), lobbed a $2.70 takeover bid for the entire TRS business. I figured that he may have done similar math to me, and came to the same conclusion that the entire TRS was undervalued at $2.02 share price. I used that opportunity to sell, considering that $2.80 was to me, a fair value, since it was very close to the $3 I had originally sold it at, and was very close to the liquidation value of $67m that I had calculated.
Afterpay (ASX: APT) – sold in Sept 2018, at the ~$18 mark:
This is possibly one of the best stocks I have chosen thus far in my investing career. I confess though, I usually agree with my mentor, but this stock was one where we had pretty divergent views on.
I tell everybody my story of how I discovered APT, by walking in July 2017 around Macquarie Shopping Centre with my mother, and noticing the APT logo stickers outside several retailers like Athletes Footwear at the time. I then began stalking it like a hawk, keeping track of the general number of APT stickers outside retailers. By December 2017, virtually all the retail stores on level 3 had the APT stickers in the shopping centre.
Of course if you assume that APT could be doing the exact same thing across all shopping centres (considering there are ~1700 centres in Australia), it was not hard to imagine the total addressable market. At the time, APT also had plans to expand into the US, which was a retail market almost 20x larger than Australia.
To me, the most important metric was price/underlying sales, where underlying sales (or GMV for those familiar with the term of ‘gross merchandise volume’) is basically the sales volume transacted in a period. To calculate this price/underlying sales, I note the market capitalisation at $5.50, was ~$1.3b, and the underlying sales (per management guidance from APT) was expected to be ~$2b. My price/underlying sales was ~0.65x. This looked reasonable, as I was effectively paying 65c for every $1 for sales volume. It compared reasonably to peers like Paypal and Zippay on that basis.
APT makes 4-6% commission from the merchant (eg Myer, David Jones, etc) for the sales price of any transaction done through the Afterpay system, plus 30c. Other competitors like Zippay (ASX: ZML) actually do similar, and in fact charge a cheaper commission (3-4%), but the difference, is that APT is much better in customer service, helping merchants set up and integrate the platform into the stores, than Zippay. That did not bother me, and was enough to justify the higher premium for APT.
The stock price rose all the way to $21, on the back of a solid FY18 result, with a promising FY19 outlook. User numbers have now reached ~2.5m, and merchant numbers have now reached ~18k. The acquisition of 90% of a competitor in UK, Clearpay, in a capital raise through 1m additional APT shares issued, allowed APT exposure into the UK market, which was another addressable market like the US.
On the basis of valuation, I began to sell my stock at about $18 given how hard the stock had run, reaching $4b market capitalisation at its peak, which meant a price/underlying sales of 2x. It proved somewhat fortunate, given the selloff in September 2018 to the $12-13 level, where APT has stabilised. It should be noted, that APT was still the best performing ASX200 stock for 2018. Time and time again, I smile at the quote that my mentor, reminds me:
“The stock market always runs ahead of reality”
I agree that stocks can often run far ahead of reality, and in this instance, that was probably the case for APT. Only 1 year ago, I could recall brokers like Goldman Sachs, having fairly conservative estimates on sales/earnings for APT, before upgrading them dramatically following the 1H18 result in February 2018. It appears that sell side people may not always be right…
Nevertheless, I continue to remain primarily positive on APT, but on the execution risk with the acquisition of Clearpay, and increasing competition from global peers, it has become harder to justify the current valuation at ~$12 share price. My mentor made a good comment which I did not consider about APT. It was the fact that if APT needed a $350m loan facility to run their business, couldn’t NAB simply use that $350m themselves to create an APT like platform themselves? Of course, NAB is not entirely the same as APT, but I guess it suggests the low barriers to entry for the buy now pay later industry.
Notice that I have not discussed the elephant in the room, which is the ‘social’ aspect of APT. Earlier in the year, the stock was under attack by threats of the Labor Party imposing credit laws onto APT, because the only people who were getting APT were those who could not get a proper credit card from a bank. In my view, it is very possible that APT may be catalysing a potential borrowing problem in Australia, with people who should not be borrowing. However, I focus only on the numbers. The fact that only 0.4% of underlying sales in FY18 were net transaction losses, decreasing from 0.6% in FY17, suggests to me that it is not much cause for concern. Indeed, 0.4% of $2b is only $8m of underlying sales volume being under threat. Thus far though, 25% of sales is made up of late fees which may suggest otherwise. My view of that is that consumers are better off paying late fees to APT versus the banks, which could potentially be charging higher (e.g. ~20% late fees on credit card amounts).
This slide also shows the value proposition for APT over the banks, from the 2018 AGM presentation.

That being said, there is always something to worry about. APT is no exception. The price at which you pay though is the risk you are willing to take on for said price. Good to remember that, particularly when people attack any stock that you own. It is important to respect and listen to other people’s opinions, but remember that they may not always be right.
Specialty Fashion, now City Chic Collective (ASX: CCX) – bought in May 2018, and continues to be held:
City Chic has been a great stock to hold. In fact, this was ever since the strategic review which led to the sale of the 5 loss making brands which SFH originally owned for $31m cash, to Noni B. That allowed new management to focus solely on the City Chic brand, which was the only profitable brand out of all 6 brands. In fact, over the 10 years of operations, this was the first time anybody saw how profitable City Chic was.
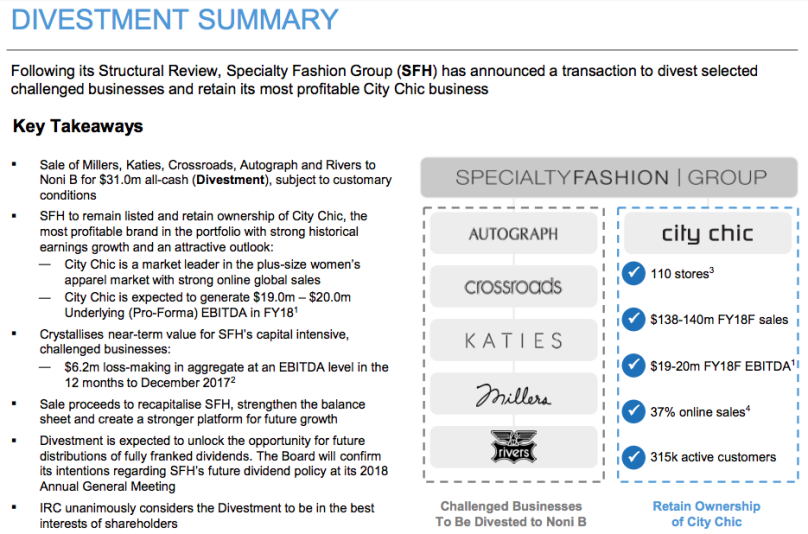
The FY19 outlook for CCX was primarily positive, with forecasted momentum to continue, which helped comparable sales growth maintain low double-digit, and like-for-like sales (i.e. LFL) growth maintaining high single digits. CCX also announced its intentions to return dividends through a payout ratio of ~50% of NPAT. Note that the last dividend paid was back in 2014.
So far so good, for CCX is how I would describe it. The new management team, with CEO, Phil Ryan (who has been with CCX for more than 10 years), appears to be meeting the promises he has set. I think what the market is overlooking about this stock, is the online sales of CCX, which generates almost 40% of sales (and which I think could easily become 60-70%, especially through the wholesale partnerships in the US that have been signed). This is one of those fashion retailers, who have invested earlier than other peers, into their e-commerce business. For example, I spoke to H&M staff recently, and they told me they did not have an online store yet!
I continue to remain positive on the outlook, considering the thesis for selling female clothing to a niche audience, and that is, slightly bigger girls who need the size 14+ clothes.
On valuation metrics, when I bought the stock it was trading on roughly 12x trailing PE if you assumed the FY18 EBITDA flowed through to an estimated FY18 EPS. For a fashion retailer with potential for sales growth and earnings growth, this was just too good. I had no trouble expecting NPAT to grow at least 12% in FY19, considering costs can still be removed from the business. This would mean a PEG (Price/Earnings to Growth) of less than 1x for CCX, a fairly cheap multiple.
Some new additions to the portfolio during 2018:
QBE Insurance (ASX: QBE) – bought in Jun 2018:
QBE has been a stable performer. Nothing too complicated from a business standpoint at first glance, as it simply writes premiums and pays out claims when people need insuring. More details here.
This was a stock inspired by my mentor. The quality of QBE had deteriorated in the last few years, and saw the stock price stay relatively flat since 2011. However, the new CEO, Pat Regan (the former CFO and A/NZ CEO), had a clear strategy to simplify the business, called “brilliant basics”, which was about selling non-core assets, refocusing on core segments through cost savings, and signing reinsurance where possible to offload risk.
Pat was a good choice, considering how well he turned around the Australian/NZ business with the same pilot strategy back in 2016. Once in charge, Pat sold the non-core Latin America business for almost 2x price/book at a price of $244m, which was a signal of his good capital management approach. The Latin America business was a huge detractor to profitability for QBE.
Some temporary issues like the hurricanes in the US, affected QBE’s profitability in 2017 due to higher than anticipated claims. That being said, the fundamentals continue to remain positive. Insurance premiums continue to rise, ensuring a stable top line sales.
One of my mentor’s comments that struck me, was the investment portfolio of QBE, which holds about $27b worth of assets from 1H18, but primarily in fixed income. He noted that the modified duration (i.e. a proxy for interest rate risk measure) was the lowest in all the insurers he had seen in Australia. This allows QBE to potentially benefit from rising US interest rates, as it can refinance the bonds that it holds, faster than other peers, and at higher yields.
On a valuation metric of P/B of less than 1x (when less than $10 share price), it was just too good an investment to ignore, considering the low risk with Pat Regan’s history of success. I continue to remain positive on the long-term fundamentals of the business. Whether Pat delivers on his cost savings promised in the 2019 Reinsurance Program (that led to a bit of a market overreaction in the selloff in late 2018), remains to be seen, but I continue to remain confident in Pat’s conservative and diligent approach to management in QBE.
Wiseway Logistics (ASX: WWG) – bought in Nov 2018:
WWG is a pretty small stock, at ~$50m market capitalisation. It has operated for almost 14 years, was founded by the Tong family, and operates as a logistics company. The IPO (i.e. initial public offering) was in October 2018 on the ASX at 50c per share.
More specifically, WWG provides air freight, sea freight, domestic transportation, warehousing and customer service clearing, for over 700 business customers. It operates for general cargo and perishable goods. General includes infant milk formula and vitamins, whereas perishables include dairy, meat and seafood. WWG has built relationships as an IATA agent with most major airlines, but also several sea freight providers. WWG’s customers tend to be wholesalers, suppliers, distributors and e-commerce platforms that require freight logistics between Australia and China.
WWG’s high barriers to entry, comes from having 70% market share in outbound air freight from Australia to China, with several exclusive agreements with major airliners. Outbound freight (incl. both sea and air), make up 95% of sales. Usually, the cash flow from customers comes in the form of a freight commission plus a margin (usually based on $/kg or $/pallet or $/container), along with a documentation fee that is fixed per shipment.
Growth which I believe the market has yet to fully price into WWG, include:
Increasing freight capacity from technological innovation of containers and improved airplane carriers
General demand for air freight to shift perishable goods in a timely manner (despite being 70x more expensive than sea freight, and 20x more expensive than road freight), seen in exports to China increasing by CAGR of 13.1% YOY from 2007 to 2017
The new airline established routes between Australia and China, to open to a bigger addressable market (seen in the rapid expansion of new airports in China)
ChAFTA (i.e. China-Australia Free Trade Agreement) in 2015, reduced tariffs for merchandise exports into China – with pork and seafood tariffs being eliminated by 1 Jan 2019, which make it cheaper to export these said products to China
Growth in the middle class for consumption (towards 76% middle class of Chinese population by 2022) of imported goods (from the likes of Australia for example) that are more trustworthy than Chinese goods, in areas of agriculture, dairy, foods, etc
On a valuation basis of ~16x forward PE, it felt reasonable, considering the EPS growth expected in FY19 for ~170%, and when considering the trailing PE of 94x, the PEG comes to 0.54x which is fairly cheap, when compared to peers like DHL and Mainfreight.
Reliance Worldwide (ASX: RWC) – bought in Dec 2018:
Another stock, which was inspired by reading several fund manager reports. RWC was to me a high quality business, and all credit to the management team with CEO, Heath Sharp, who has operated for more than 10 years in RWC.
RWC is focused on providing products for behind the wall plumbing to end users, which are ultimately plumbers, through retailers and wholesalers across Australia, US and UK. Most of these products are fittings, pipes, control valves and thermostats. Its most recent acquisition of John Guest in UK for $1.2b, was in my view, a good purchase. In the words of one of my friends who analysed the stock, JG was easily a 0.5x P/B transaction. This is a signal of good capital management by RWC, for entry into the UK market.
Cash flow and sales growth has been maintained despite a reasonable amount of debt taken on to fund the acquisition of John Guest. The key product which gives RWC its competitive advantage, is the first mover advantage through brass PTC (push to connect) pipe fitting product, aka the “Shark Bite” technology, which has 90% market share in the US PTC market. This product essentially disrupts the incumbent ‘soldering’ done to re-connect pipes, as more plumbers begin to realise the cost and time efficiency of using the Shark Bite product.
However, the share price has been slightly muted in the past few months over potential concerns that this stock is tied to the housing cycle, since if fewer homes are built, less pipes and fittings for plumbing are needed. However, that would be a bit of a misunderstanding. The focus for RWC has always been on repair and maintenance jobs, rather than new housing jobs. According to RWC research, for example in the US, about 85% of their products, is used for the former, rather than the latter.
Drivers for growth that the market may be undervaluing for RWC:
1. Continued low double-digit sales growth from traditional RWC activities (note the 12% CAGR in FY08-18)
2. High single digit sales growth in the acquisition of JG, with 1st full yr of JG in FY19
3. Opportunity for water monitoring/leak detection product with additional products developed at CES (Consumer Electronics Show) in Jan 2019
4. Targeted opportunities to gain market share for PTC in APAC (Asia Pacific), EMEA (Europe, Middle East, and Africa) and US via disruption – particularly with PTC being only 12% of the US fittings market, so lots of room to grow from such a small base for RWC
It remains to be seen, although I continue to be positive on RWC. I certainly think this is a stock that could easily double in the next 1-2 years, if management guidance can be met and perhaps exceeded. RWC has proven it can surprise on the upside, as seen in the past.
Part 1 Conclusion:
This covers my reflections of predictions made in my YE 31/12/17 report (and noting what I did/did not get correct), and also my thoughts on the markets in calendar 2018, and my stocks that I have added and subtracted during the year. I admit that I wrote a lot more than I intended.
Once again, I do want to reiterate that the past is no indicator of any future performance. In some respects, the abnormality of gains comes from very fortunate timings in Afterpay (June to August 2018) and The Reject Shop (November 2018). I have been pleased with the performance of my personal portfolio these last 2 years, with a calendar 2018 return of +12.50%, and an annualised +16.22% return since Jan 2017 to Dec 2018.
I want to thank my mentor, Albert Hung, once again for somehow seeing something in me, and guiding a clueless 3rd year UNSW student like myself, into funds management. I continue to benefit from all the yumchas, phone calls, and whatsapp messages I have with him, and I think the ~1.5 years of knowing him has changed me a lot for the better. Much of my investing process is thanks to him laying the groundwork, and me merely expanding further on it for myself. Time and time again, I come back to quality, valuation and energy as the most important factors of a business. As the featured image suggests, I am constantly ensuring that I am “fishing from the safety of a wharf”.
I want to repeat that there is no guarantee that I can continue reporting anything in my blog, for the sake of my clients in my future role that begins in February 2019. However, I am always more than happy to have in-person coffee chats, email correspondence or phone calls about my portfolio where appropriate. I love meeting people and sharing whatever I have learned in my career. I also do hope to learn from anybody and everybody as well (especially my new work place!).
Stay tuned for the part 2 blog post (see here now!), which will cover my outlook for the calendar year 2019, and my stocks I am watching closely (and potentially buying soon). I hope to have that up within the next few days.
Wishing all my readers a happy new year, as we begin 2019.
Kind regards,
Michael Li